


Results of Radioactive Material Analysis in the Vicinity of the Fukushima Daiichi Nuclear Power Station
Daily measurement data and analysis results are announced, enabling the public including local communities to confirm radiation levels in the area.
Use of the data is explained here.
Results of radioactive material analysis at each collection point (for June 2026)
Air
Air at power station site
Radionuclide analysis is conducted of air collected inside the power station site.
Note:As of the samples collected August 30, 2017, gamma radionuclide analysis of dust collected at three monitoring points at the west gate and boundary of the site (MP-1, 3, 8), at three locations near Units 1 to 4 (north-side slope near Unit 1, west side slope near Units 1 and 2, west-side slope near Units 3 and 4), and on the ocean side of Units 1 to 4 was stopped, changing to observations by continuous dust monitors located inside the site.
For reference: See here for the status of dust monitor measurements near the Fukushima Daiichi Nuclear Power Station site boundary.
Note: Sampling for analyzing strontium and plutonium in the air with a monitoring car located near the west gate of the site is continued once every six months (April and October).
Seawater
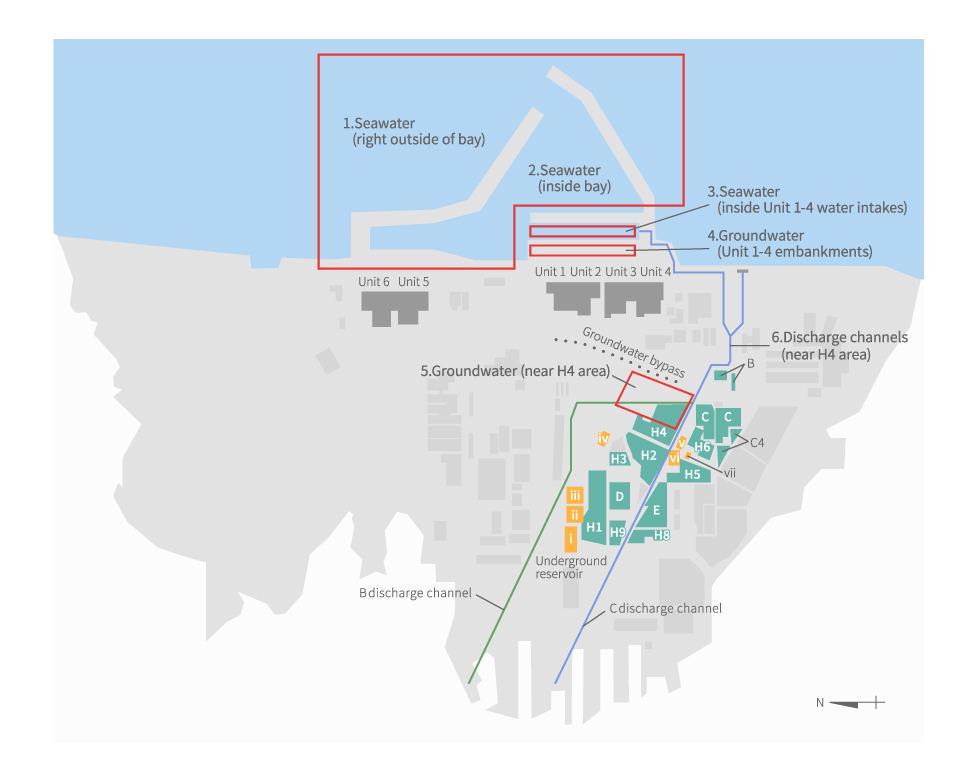
Radionuclide analysis is conducted of seawater collected along the coast of the power station, etc.
| Sampling PlaceEnglish form See here for maximum values Data CSV: Coast / Near water intakes / within 3km from the power station |
|---|
| 1234567891011121314151617181920212223 |
As of November 6, 2023, the place where the radionuclide analysis results of seawater in the bay of the Fukushima Daiichi Nuclear Power Station are posted was changed. Please see here. (PDF files posted in the section of "Monitoring on east side of Unit 1-4 turbine buildings and bay")
Seawater at bay entrance (measured by radioactivity monitors)
Starting October 1, 2016, data indicating the latest status in 10-minute intervals is made available in real time.
See here (in Japanese only) for analysis results by Association of Fukushima Prefecture Environmental Measurement and Radioactivity Measurement (tentative translation). *
* The association cooperates by providing a system to objectively confirm TEPCO’s measurement values through participation by companies accredited to ISO standards for environmental radioactivity analysis (ISO/IEC 17025), who measure the same samples as TEPCO as third parties.
See here for Overarching Radiation-monitoring data Browsing System in the coastal ocean of Japan. *
- *In addition to the sea area monitoring results inside and outside of the bay, etc. conducted by TEPCO, and sea area monitoring results at various places published by related ministries and agencies, local governments, etc. can be comprehensively viewed on a map.
ALPS treated water sampling
Before diluting and discharging ALPS treated water, the concentrations of radioactive materials, etc., contained in the ALPS treated water are checked at the measurement/confirmation facility to ensure that it satisfies the discharge criteria. In order to ensure the objectivity of the analysis results, the concentrations of radioactive materials are analyzed by a third-party (Japan Atomic Energy Agency) in addition to an external agency commissioned by TEPCO.
| Nuclides to be measured and assessed | Tritium | Nuclides to be checked voluntarily | |
|---|---|---|---|
| Discharge criteria | The sum of the ratios of the concentration of each radionuclide to the regulatory concentration (sum of the ratios to regulatory concentration limit) less than 1 | less than 1 million Bq/L | no significant concentrations found of any of the nuclides |
| Language | Pre-discharge analysis results of the water in the measurement/confirmation tanks |
|---|---|
| English |
The most recent data is from May 28, 2026. (Group B) |
| Korean |
The most recent data is from May 28, 2026. (Group B) |
| Simplified Chinese |
The most recent data is from May 28, 2026. (Group B) |
| Traditional Chinese, Taiwan |
The most recent data is from May 28, 2026. (Group B) |
| Traditional Chinese, Hong Kong |
The most recent data is from May 28, 2026. (Group B) |
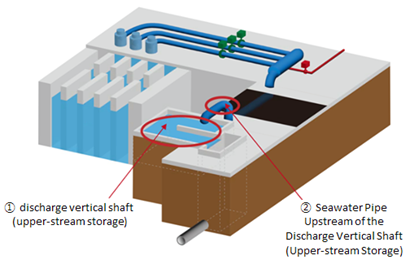
The water in the discharge vertical shaft and the water in the seawater pipe
During discharge, the tritium concentration in the water in ② the seawater pipe upstream of the discharge vertical shaft is measured (analysis value*) on a daily basis to confirm that the analysis value is consistent with the estimated tritium concentration (calculated value*), and less than 1,500Bq/Liter, which is TEPCO’s limit for discharge into the sea.
Furthermore, the flow of ALPS treated water and seawater into the discharge vertical shaft will be temporarily halted once a year before ① the discharge vertical shaft (upper-stream storage) becomes full, so that the tritium concentration in the water in the shaft can be measured (analysis value*). At this point we will confirm that the analysis value is consistent with the estimated tritium concentration (calculated value*) and lower than 1,500Bq/Liter, which is TEPCO’s limit for discharge into the sea, and there are no abnormalities on the status of current facilities.
| Concentrations of tritium (Discharge vertical shaft) | ||
|---|---|---|
| Analysis Value | Comparison with calculated value | |
| Summary | The analysis value is consistent with the calculated value, and lower than 1,500Bq/L | |
- *
Analysis value and calculated value contain uncertainties.
For more details, please see the following materials (pdf)
| Language | Analysis results of the water in the discharge vertical shaft (Upper-stream storage) |
|---|---|
| English |
The most recent data is from March 5, 2026. |
| Korean |
The most recent data is from March 5, 2026. |
| Simplified Chinese |
The most recent data is from March 5, 2026. |
| Traditional Chinese, Taiwan |
The most recent data is from March 5, 2026. |
| Traditional Chinese, Hong Kong |
The most recent data is from March 5, 2026. |
Click here for analysis results from third parties (Japan Atomic Energy Agency)
| Language | Analysis results of the water in the seawater pipe upstream of the discharge vertical shaft (Upper-stream storage) |
|---|---|
| English | 23456789101112131415161718192021 |
| Korean | 23456789101112131415161718192021 |
| Simplified Chinese | 23456789101112131415161718192021 |
| Traditional Chinese, Taiwan | 23456789101112131415161718192021 |
| Traditional Chinese, Hong Kong | 23456789101112131415161718192021 |
Quick measurement of seawater
Index, as “Discharge Suspension Level”, has been set in order to determine if the discharge needs to be suspended as the facility operation in the event that sea area monitoring results indicate that the water to be discharged is not dispersing sufficiently.
We have also set an “Investigation Level” as an index for determining actions (inspection of facilities and operating procedures, increased monitoring, etc.) if concentration levels that exceed one half of the aforementioned index (Discharge Suspension Level) are detected. During the monitoring with these indexes, we are in effect raising the detection limit which will allow us to obtain analysis results quicker and ascertain conditions of the sea more rapidly.
| Locations within 3km of the power station | Locations within a 10km square in front of the power station | |
|---|---|---|
| Index | Discharge Suspension level (700Bq/L) and Investigation Level (350Bq/L)* |
Discharge Suspension level (30Bq/L) and Investigation Level (20Bq/L)* |
- *Suspension Level:
Index for determining if discharge needs to be suspended.
- Investigation Level:
Index for determining actions (inspection of facilities and operational procedures, increased monitoring, etc.) to be taken before the Discharge Suspension Level is reached.
| Language | Analysis results of seawater (Measurements to obtain results quickly) | Sampling locations |
|---|---|---|
| English | 234567891011121314151617181920212223 | |
| Korean | 234567891011121314151617181920212223 | |
| Simplified Chinese | 234567891011121314151617181920212223 | |
| Traditional Chinese, Taiwan | 234567891011121314151617181920212223 | |
| Traditional Chinese, Hong Kong | 234567891011121314151617181920212223 | |
Subdrain water
Radionuclide analysis is conducted of radioactive materials in water collected from subdrains, etc. near the turbine buildings of Units 1 to 6 and the subdrain near the central waste treatment facility.
| Subdrain water near turbine building | English form |
|---|---|
| 2469111316182023 | |
| Subdrain water near the centralized waste treatment facility | English form |
|---|---|
| 1234567891011121314151617181920212223 | |
Subdrain and groundwater drain sampling
Groundwater near buildings is pumped up before it can enter the buildings (measure to minimize increase in contaminated water). Moreover, groundwater flowing toward the sea that has been dammed up by installing an ocean-side impermeable wall (measure to prevent contaminated water from leaking) is pumped up, cleaned, and checked for water quality before being discharged into the ocean, in a water treatment facility for subdrain, etc. that went into operation in September 2015. Groundwater that has been pumped up is stored in temporary storage tanks, radioactivity levels are measured, and confirmation is made that it is within operational targets.
To ensure objectivity of the analysis results, radiation level analysis is also conducted by third-party agencies.
| Cesium-134 | Cesium-137 | All beta | Strontium | Tritium | |
|---|---|---|---|---|---|
| Operational targets for temporary storage tanks | 1Bq/L | 1Bq/L | 3Bq/L | - | 1500Bq/L |
| (For reference) Regulatory limits | 60Bq/L | 90Bq/L | - | 30Bq/L | 60000Bq/L |
| WHO guidelines for drinking-water quality | 10Bq/L | 10Bq/L | - | 10Bq/L | 10000Bq/L |
An overview of subdrain initiatives and implementation status is given here.
| Temporary storage tank and water collection tank analysis results | English form |
|---|---|
| 235678910111213141516171819212223 | |
| Weighted average sample analysis results | |
|---|---|
|
The most recent data is from May 21, 2026. Note:Analysis is conducted on water collected before discharge after mixing in the same ratio as that of discharged water each time to all discharged water for that month. |
| Analysis results for discharged water | English form |
|---|---|
| 23 | |
Transfer tank analysis results : The most recent data is from June 14, 2016. (English form)
Groundwater bypass-related sampling
As a measure for minimizing the increase in contaminated water, a groundwater bypass went into operation in May 2014, by which groundwater on the mountain side is pumped up before it can enter buildings and its water quality is confirmed before it is discharged into the ocean. Groundwater that has been pumped up is stored in temporary storage tanks, radiation levels are measured, and confirmation is made that it is within operational targets.
To ensure objectivity of the analysis results, radiation level analysis is also conducted by third-party agencies.
| Cesium-134 | Cesium-137 | All beta | Strontium | Tritium | |
|---|---|---|---|---|---|
| Operational targets for temporary storage tanks | 1Bq/L | 1Bq/L | 5Bq/L | - | 1500Bq/L |
| (For reference) Regulatory limits | 60Bq/L | 90Bq/L | - | 30Bq/L | 60000Bq/L |
| WHO guidelines for drinking-water quality | 10Bq/L | 10Bq/L | - | 10Bq/L | 10000Bq/L |
An overview of the groundwater bypass initiative and implementation status is given here, along with related materials.
| Pumping well analysis results | English Form See here for maximum values. |
|---|---|
| 1368101315172022 | |
| Temporary storage tank analysis results | English Form |
|---|---|
| 11019 | |
| Weighted average sample analysis results | English Form |
|---|---|
|
The most recent data is from May 22, 2026. |
|
| Analysis results for discharged water | English Form |
|---|---|
| 23 | |
Monitoring for tank leakage
In response to leakage from a bottom flange of Tank No. 5 in the I group of the H4 tank area discovered in August 2013, dripping from an upper top plate of a B south area tank (B-A5) occurring in October 2013, and leakage from a flange of an upper top plate of the C1 tank in the H6 tank area occurring in February 2014, ongoing sampling has been implemented to monitor the effects of such leakage. This sampling is conducted near the south discharge outlets of the Fukushima Daiichi Nuclear Power Station, the discharge channels on the site premises, and around the H4 area tanks.
| Observation holes around the H4 tank area | English Form See here for maximum values. |
|---|---|
| 41118 | |
| Observation holes around the H6 tank area | English Form See here for maximum values. |
|---|---|
| 41118 | |
South discharge outlets and discharge channels
Note:Starting September 2018, a change was made to where the analysis results are archived for the south discharge outlets and discharge channels.
See here for the analysis results for the south discharge outlets. See here for the analysis results for the discharge channels.
Monitoring on east side of Unit 1 to 4 turbine buildings and bay
Radionuclide analysis is conducted of groundwater on the east side of Unit 1 to 4 turbine buildings and of seawater in the bay, for confirming sources of radioactive materials in groundwater and their diffusion status, and for monitoring impact on the ocean.
| Sampling PlaceEnglish form See here for maximum values. |
|
|---|---|
| 1234567891011121314151617181920212223 | |
| CSV data [updated every Friday] | Seawater in the bay, Groundwater ( North of Unit 1 , Between Unit 1 and 2 water intakes , Between Unit 2 and 3 water intakes, Between Unit 3 and 4 water intakes)
Please click here to see CSV data for and prior to August, 2020. |
As of November 6, 2023, the place where the radionuclide analysis results of seawater outside the bay of the Fukushima Daiichi Nuclear Power Station are posted was changed. Please see here. (PDF files posted in the section of "Seawater")
Sampling data from discharge channels on the premises of the Fukushima Daiichi Nuclear Power Station
Monitoring of each of the discharge channels continues, since rainwater flows into the channels after falling on the turbine building roofs, which were contaminated by fallout at the time of the accident.
| English Form See here for maximum values. |
|
|---|---|
| 123456789101112 (See Highest Dose)1314151617181920212223 |
Analysis results for underground reservoirs
In response to the external leaking of water stored in an underground reservoir, occurring in April 2013, impact on the surroundings is being monitored, analyzing groundwater at leak detection holes installed next to the reservoirs and observation holes around them.
Note that the amount of underground reservoir leakage was thereafter assessed to be around 20 to 30 liters.
- 23
Analysis Results of the Groundwater Bypass Investigation Holes
- 17
Analysis Results of the Groundwater Bypass Investigation Holes
- 16
Analysis Results of the Groundwater Bypass Investigation Holes
- 10
Analysis Results of the Groundwater Bypass Investigation Holes
- 9
Analysis Results of the Groundwater Bypass Investigation Holes
- 6
Analysis Results of the Underground Reservoirs (Surrounding Observation Holes)
Analysis Results of the Underground Reservoirs (Drain Holes, Detection Holes, Seaside Observation Holes) - 5
Analysis Results of the Underground Reservoirs (Surrounding Observation Holes)
Analysis Results of the Underground Reservoirs (Drain Holes, Detection Holes, Seaside Observation Holes) - 4
Analysis Results of the Underground Reservoirs (Surrounding Observation Holes)
Analysis Results of the Underground Reservoirs (Drain Holes, Detection Holes, Seaside Observation Holes) - 3
Analysis Results of the Groundwater Bypass Investigation Holes
Analysis Results of the Underground Reservoirs (Drain Holes, Detection Holes, Seaside Observation Holes) - 2
Analysis Results of the Groundwater Bypass Investigation Holes
Analysis Results of the Underground Reservoirs (Surrounding Observation Holes)
Analysis Results of the Underground Reservoirs (Drain Holes, Detection Holes, Seaside Observation Holes)
Other
- 16
- 11
English Form
- in the ocean soil off the coast
- Seawater collected in offshore area of Miyagi Prefecture
- Seawater collected in offshore area of Ibaraki Prefecture
- Radioactive materials in the fallouts
- Radioactive Material Concentration in the Air (Units 1-4)
- Radioactive Material Concentration in the Air (Granular Solid Body Storage Tank)
Sampling of sprinkled water that has been treated in rainwater treatment equipment after being dammed in tank area
Rainwater dammed in the tank area, after being treated using the reverse osmosis (RO) desalination and other systems, since May 2014 has been sprinkled on the premises of the Fukushima Daiichi Nuclear Power Station. To confirm the impact of this sprinkling, levels of radioactive materials in the treated water (sprinkled water) and in the air at the sprinkling locations, and the surrounding air dose rates, are analyzed.
The most recent data is from June 14, 2016. (English Form)
Detailed analysis results of groundwater around Unit 1 to 4 buildings
In purification testing of wells (subdrain pits) adjacent to Unit 1 to 4 buildings, radioactive materials were detected in water accumulated in the pits. Given the possibility that the source of this radiation is from fallout, new observation pits were installed near Unit 1 to 4 buildings, and fallout is being monitored.
The most recent data is from October 1, 2014.
Water Treatment Equipment Analysis Results
| English Form |
|---|
|
The most recent data is from May 26, 2026. |
Fish, Shellfish and Seaweed Analysis Results
(waters within 20 km of Fukushima Daiichi Nuclear Power Station)
At the time of the accident, highly concentrated contamination in the basement of the turbine building flowed into the port through underground trenches. Therefore, we analyze fish and shellfish sampled within a 20 km radius around the power station in order to check the effects of cesium on fish and shellfish and the trends.
In accordance with the government‘s policy on the water treated with multi-nuclide removal equipment etc., we have strengthened monitoring of fish and seaweed since April 2022 in order to continuously check the diffusion status centered around tritium into the sea and the conditions of marine organisms. We have increased the number of locations, targets and frequency for measurement, and set detection limits (lower detection limits) to be in line with national targets. Please click here for details.
| Sampling Place English Form |
|---|
|
The most recent data on fish is from May 25, 2026. The most recent data on seaweed is from December 24, 2025. |