


Calendar of actual maximum demand in the past(Tokyo area)
Previous day’s record will be posted at approx. 6:00 am daily, and updated at approx. 6:30 pm if necessary.
Previous day’s record will be posted at approx. 6:00 am daily, and updated at approx. 6:30 pm if necessary.
,
*As the peak demand data will display from the 2nd day.
| Date (Day of week) |
Kinds | Peak demand time zone |
Actual maximum demand |
Max supply capacity |
Consumption rate |
|---|

*Demand results may be revised in retrospect of past data.
*Please note, we will not basically announce or provide previous demand data when we correct the demand result.
Monthly peak demand
(Will be posted on the 2nd day of each month.)
A table listing the peak demand occcurrence dates since January, 2016 and that day’s performance value will be displayed (Will be posted on the 2nd day of each month.)
| Display | Date (Day of week) |
Peak demand time zone |
Actual maximum demand |
Max supply capacity |
Actual consumption rate |
|---|
| Display | Date (Day of week) |
Peak demand time zone |
Actual maximum demandMax supply capacity | Actual consumption rate |
|---|


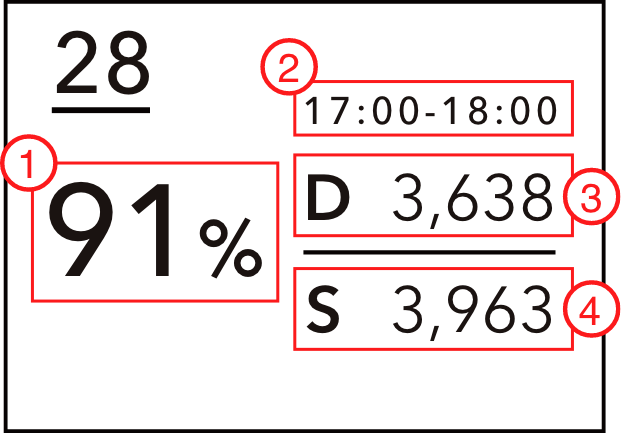
How to view "Calendar of actual maximum demand in the past"
Monthly record of daily actual maximum demand, consumption rate in peak usage times and that day’s max supply capacity can be viewed here.

-
 Consumption rate
-
 Peak demand zone
-
 Actual maximum demand(unit:×10MW)
-
 Max supply capacity(unit:×10MW)
*The day marked with a is the day of that month with the largest power consumption
Consumption rate calculations based on actual maximum demand and that day’s max supply capacity.
Indicates actual power, supply capability, consumption rate, and time period of peak consumption rate time.
The month’s peak demand occurrence date and record.
*In cases where supply capacity changes during the day, given that calculations are based on the most recent revised value, the value may differ from that day’s consumption rate value.
Daily peak generational output capacity.
*As a general rule, if the supply capacity changes during the day, the most recent revised value will be displayed irrespective of the peak demand time zone.
The month’s peak demand occurrence date and record.
*Display to be begin from the 2nd day of each month.